Dashboard
1. Introduction
Phoenix Security aims to simplify the way application security control is done, and it starts with the Dashboard. The Dashboard gives a high-level overview of the organisation’s overall status and serves as the default page upon successfully signing into your Phoenix Security account.
In situations where each second counts, Phoenix Security’s Dashboard offers a user-friendly and highly intuitive all-in-one graphical interface that makes it easy for you to monitor and access crucial information. This data then enables you to manage your security posture with only a few clicks, allowing you to proactively address vulnerabilities at the onset. Such powerful capabilities provide increased reliability for mission-critical applications.
2. Parts of the Dashboard
The Dashboard is designed to highlight the most important data using a clean and organised single-page layout. By employing familiar visuals such as graphs, heat maps, and speedometer-like dials, as well as colour-coded severity indicators, you can quickly identify and prioritize what needs to be attended to:
- Red – Critical Severity
- Orange – High Severity
- Yellow – Medium Severity
- Green – Low Severity
- Blue – No Risk
Here are the parts of the Dashboard:
Navigation Menu
The Navigation Menu gives you easy access to the other pages of Phoenix Security. Found at the left side of the Dashboard and all other pages, it remains fixed there even while you scroll up or down the pages.
Each menu item has its own icon for visual identification. Several menu items like Risk Explorer, assets, and External Dependencies are expandable to reveal more options.
In the top right hand corner of the page you can find your account information such as your email address and profile picture.
Click on your username or email address to view your profile or log out of your account.
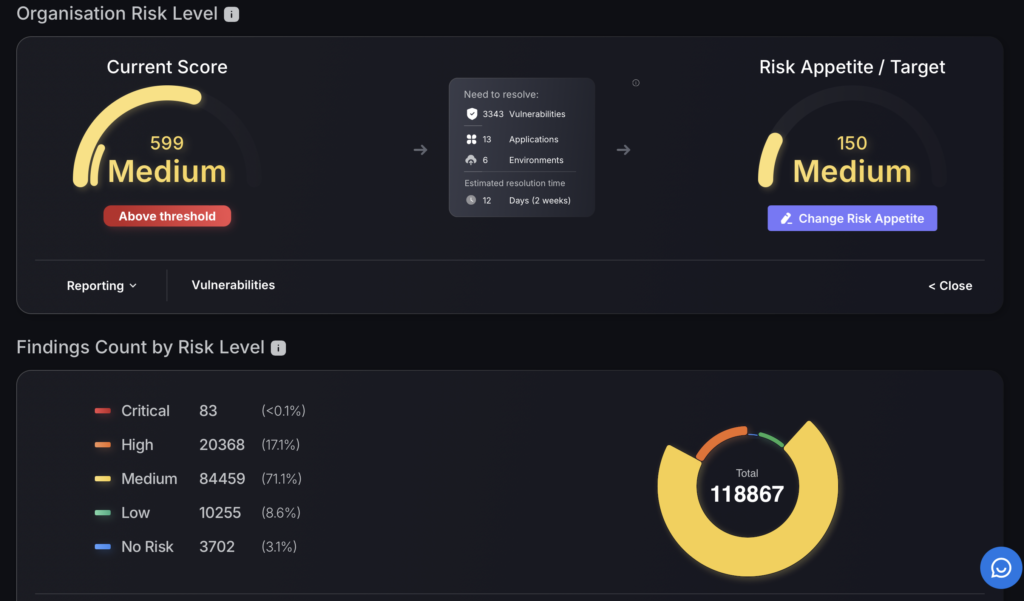
Overall Company Risk Score
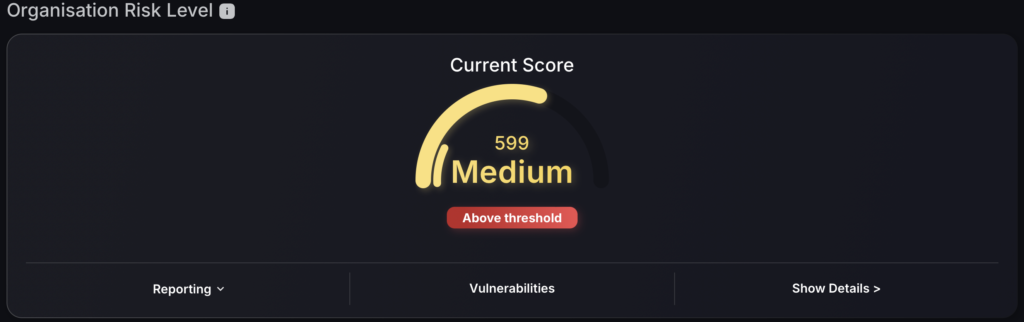
Strategically located at the top of the Dashboard, the Overall Company Risk Score provides the general status of your organisation.
Using a familiar speedometer-like dial chart, the colour-coding mechanism and easy-to-read text, it tells you the current severity level.
Additional options are available at the bottom, including:
- Reporting – generate a report of the top 10 vulnerabilities
- Vulnerabilities – shortcut to vulnerabilities section where you can view vulnerabilities in more detail and start creating tickets
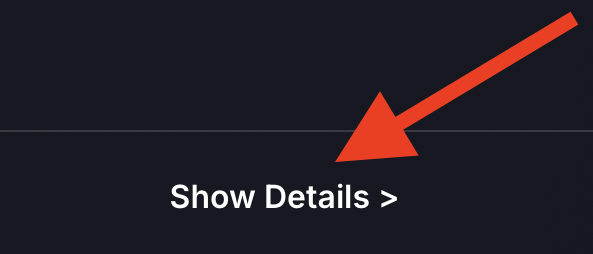
- Show Details – Gives you breakdown of areas affected, estimated time for resolution and the option to change the risk appetite/ risk tolerance/ organization threshold
Setting Risk Appetite
- Select “Show Details” in the bottom right section of the Organisation Risk Level tab.
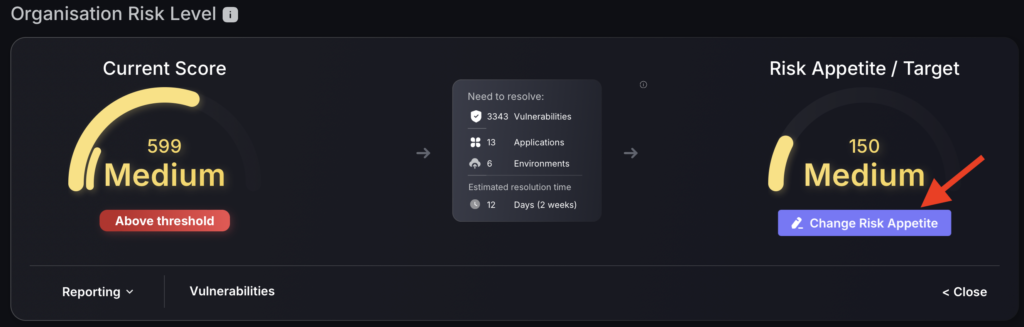
- Click “Change Risk Appetite”.
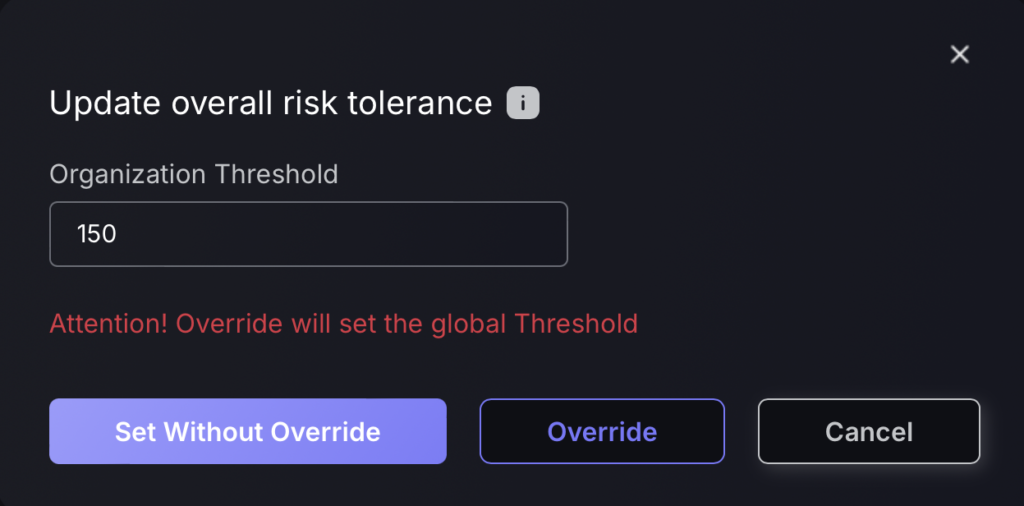
You have two options to set the Organizational Threshold/ risk appetite:
- Set Without Override – the orange button that lets you set the value just for the Organizational Risk Evolution section. This change will not affect applications that have their own threshold value set.
- Override – the red button that lets you set the value globally throughout the whole application. This change will override the existing threshold value set for the whole system, including applications that currently have their own values set, effectively setting all apps at the same threshold.
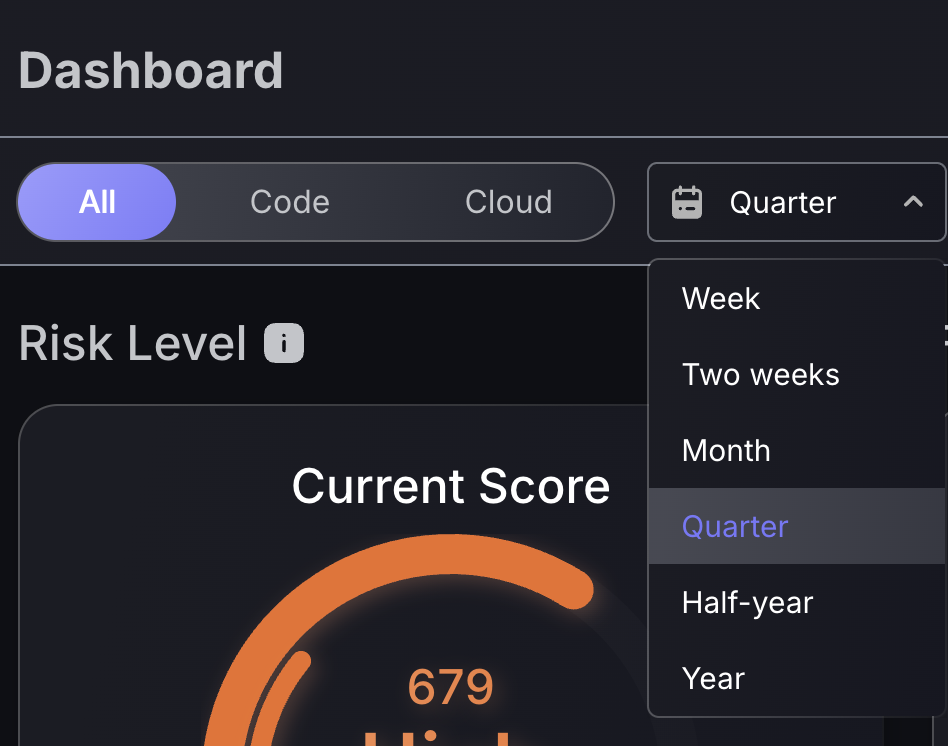
Cloud and Code scope toggling and timeframe switch
Application and infrastructure security often operate in silos, with AppSec teams focusing on code, while cloud security engineers focus on tracking infrastructure risks. That division can create blind spots, especially when teams prioritize one domain over the other.
Phoenix Security solves this with the Global Scope Filtering, allowing every dashboard, metric, and visualization to be instantly toggled between:
- Code (AppSec): vulnerabilities in applications, APIs, CI/CD pipelines, and software dependencies.
- Cloud (OpSec): misconfigurations, infrastructure exposures, identity risks, and cloud-native vulnerabilities.
This filter system ensures that both domains, application and operational, receive equal visibility and analytical depth. Whether you’re tracking unresolved vulnerabilities, SLA compliance, team performance, or risk exposure trends, the data respects your chosen context.
For instance:
- Remediation teams can triage based on the attack surface.
- Security leads can focus on AppSec findings during sprint reviews, then switch to Cloud risks for quarterly compliance audits.
- CISOs can use financial exposure charts, scoped to cloud or code, to quantify risks by business domain.
Use the timeframe selection at the top of the screen to change the timeframe scope of all features within the dashboard.
Dashboard customisation
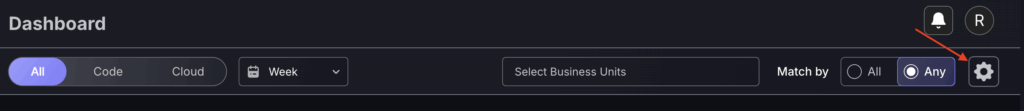
Located in the top right corner of the Executive, Security and individual teams dashboards, the dashboard customisation feature allows you to select which charts/tables are displayed on your screen.
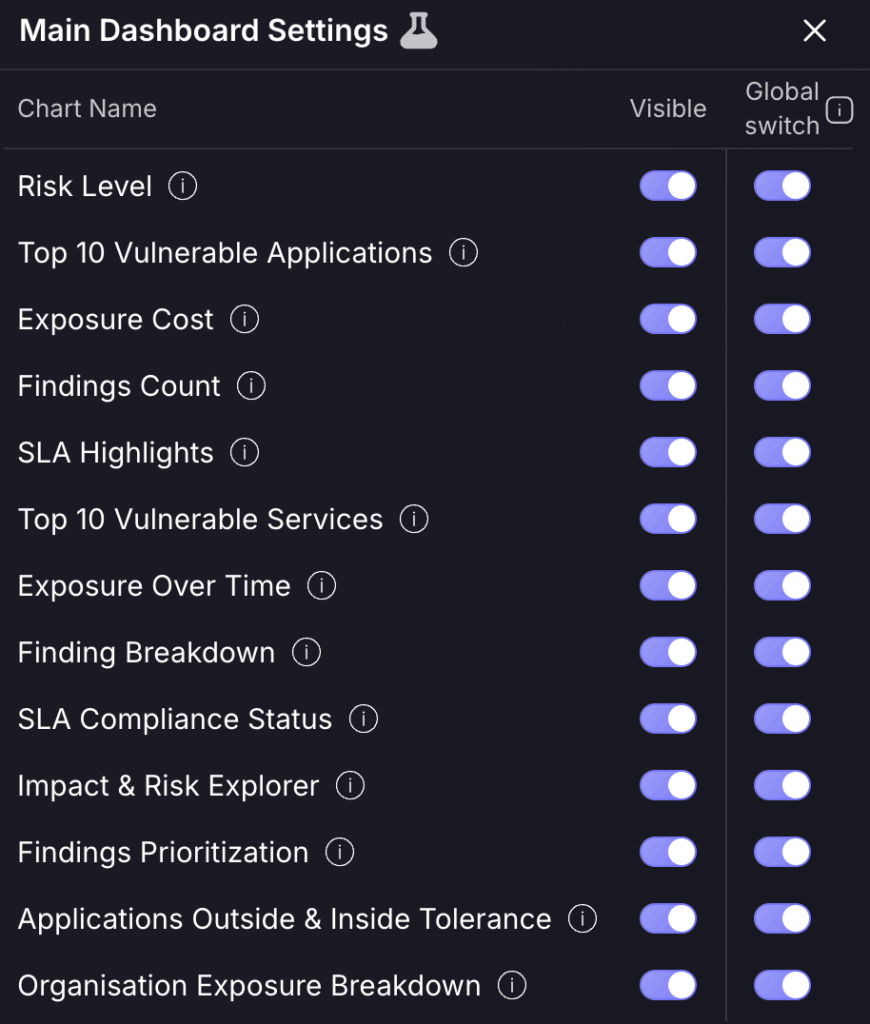
Visible switch – this will remove the feature from your own dashboard and only from that selected dashboard.
Global Switch – this will remove the feature from all user dashboards within your organisation, including your own. This only applies to that specific dashboard and would not affect the security dashboard if it were applied to the executive dashboard.
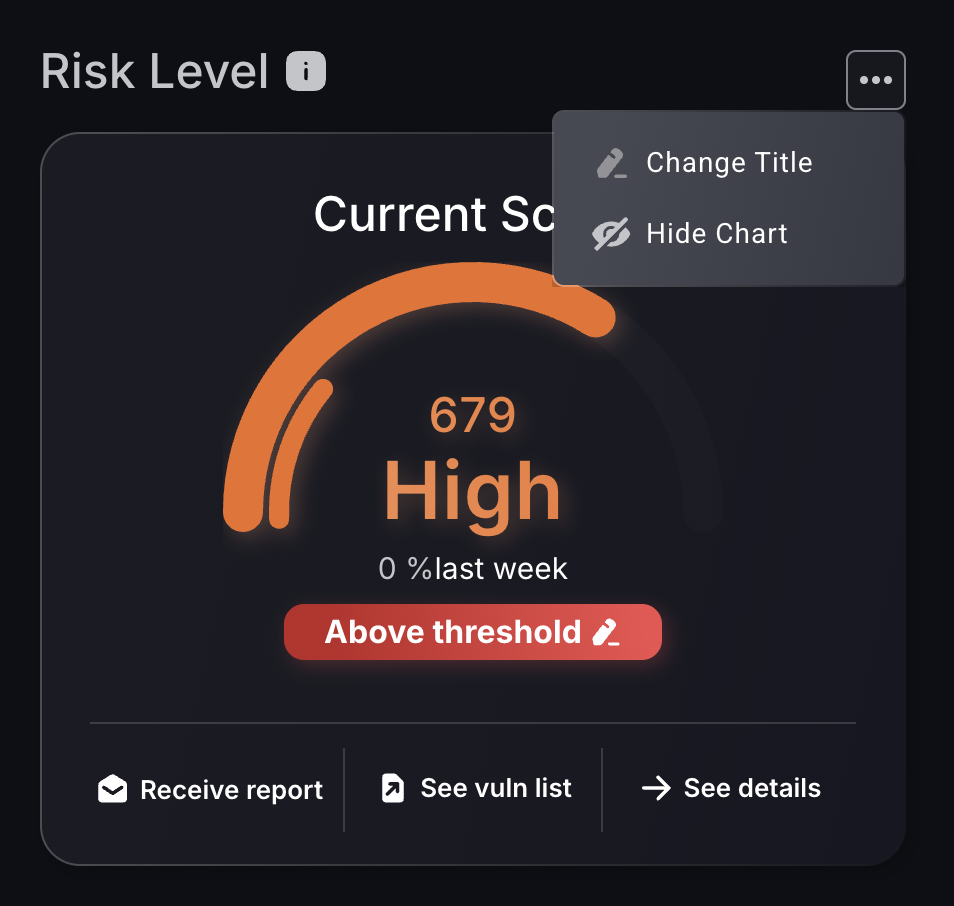
Editing features
Dashboard features can also be hidden by clicking on the three dots located on the top right of the feature tile and selecting “Hide chart”.
You can also change the names of dashboard features to better suit your preferences by selecting “Change Title”.
Findings count
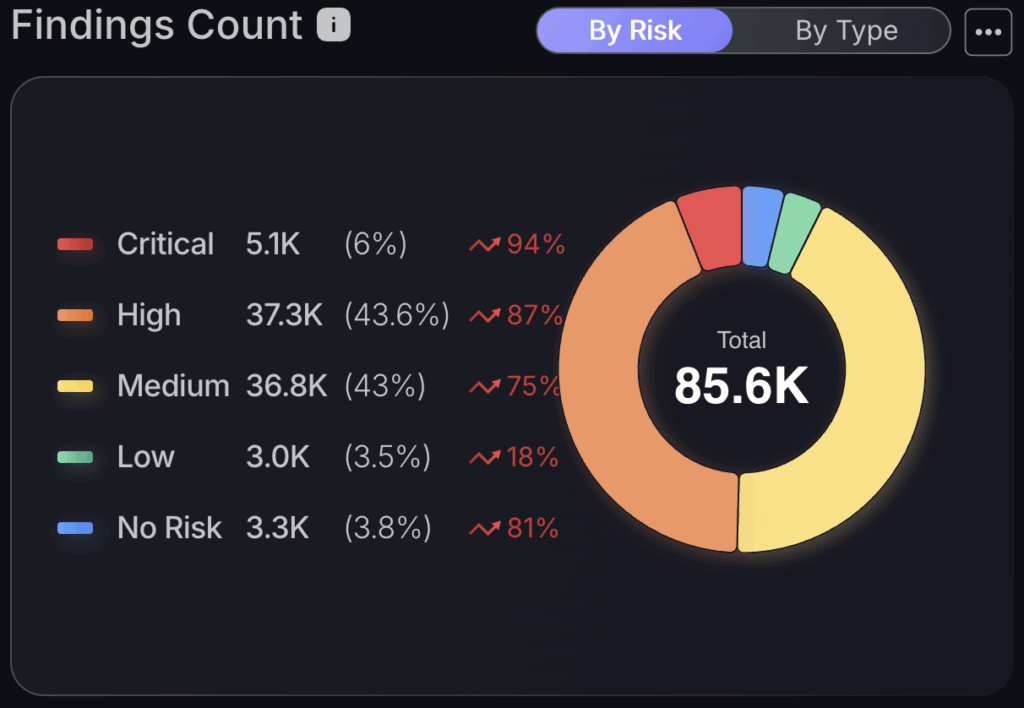
To instantly surface how your security posture has changed over time, use the “Findings count” by risk chart to see if, most importantly, your criticals have spiked/decreased or any other criticality grouping by using the percentage increase metrics. For insight into how different asset types have progressed in terms of risk, click the “by type” option to the top right of the tile.
Findings Count by Risk Level
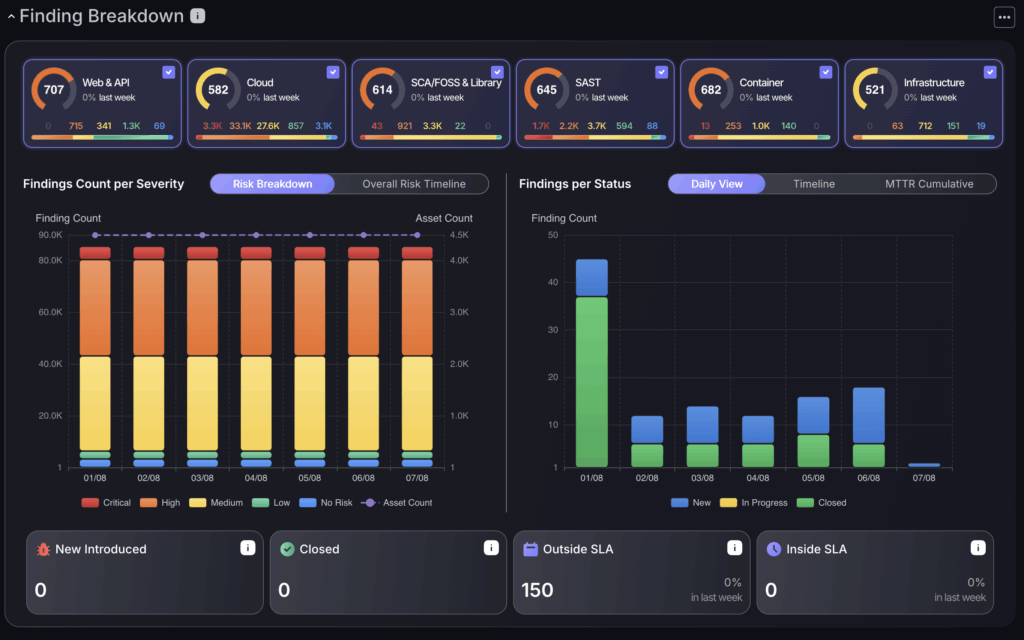
This chart allows you to break down your findings by attack surface. Click across the different asset groupings at the top of the chart to see your findings distributions across the “Findings per severity” chart which indicates how many findings and assets are within each criticality grouping within the “Risk breakdown” and the “Overall risk timeline” to display how your overall risk evolves over time. The “Findings per Status” chart allows you to track the status’ of findings, including how many are newly introduced or closed, how many have been fixed and the average fixing rates within the “MTTR cumulative” chart.
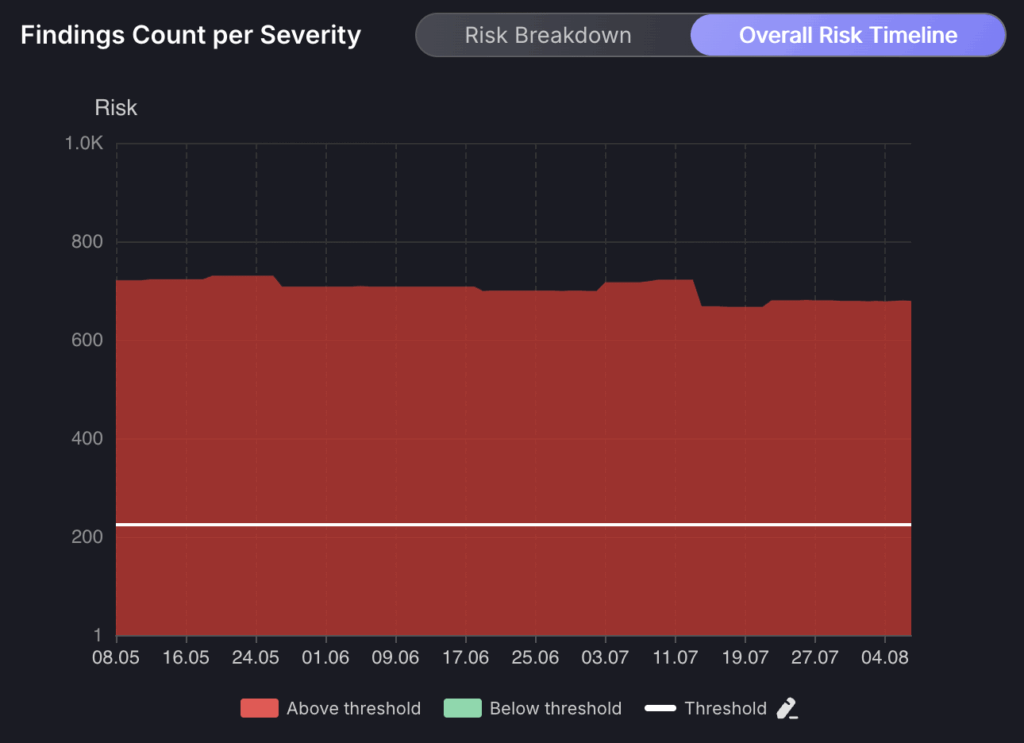
Overall Risk Timeline
The overall risk timeline section gives you two options to view a breakdown of risk evolution: the “Risk Breakdown” which displays the evolution of risk over time and the “Overall Risk Timeline” which displays the evolution of risk over time based on the overall risk level of your organisation. The threshold can be set here to track if your organisation is keeping in compliance with expected risk tolerance levels.
Applications/Environments Outside & Inside Tolerance
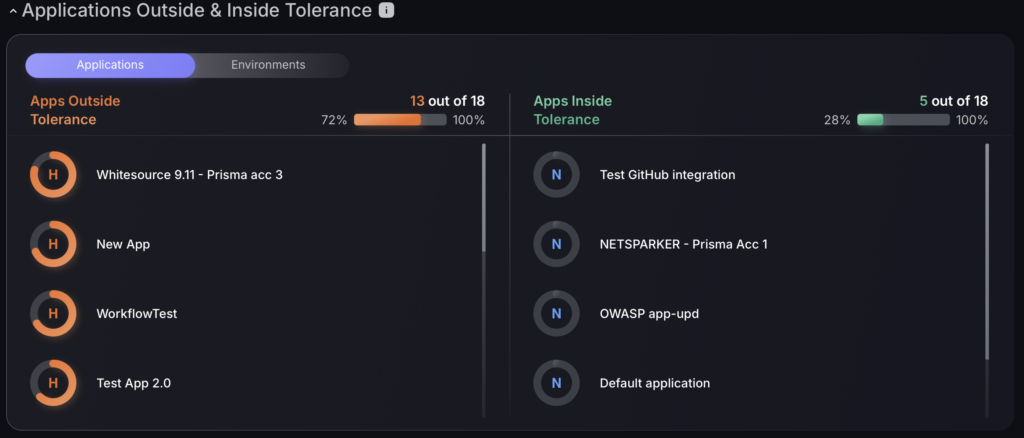
Apps Above Tolerance and Apps Below Tolerance are sections that provide a real-time list of the organisation’s Applications that are above and below the threshold level respectively.
This section is divided into two columns:
- Apps Above Tolerance – the left side column that lists down the apps that are above their current threshold.
- Apps Below Tolerance – the right side column that lists down the apps that are below their current threshold.
There is also an option to view environments inside and outside tolerance by clicking on the grey environments button under the tab title.
Organisation Exposure Breakdown
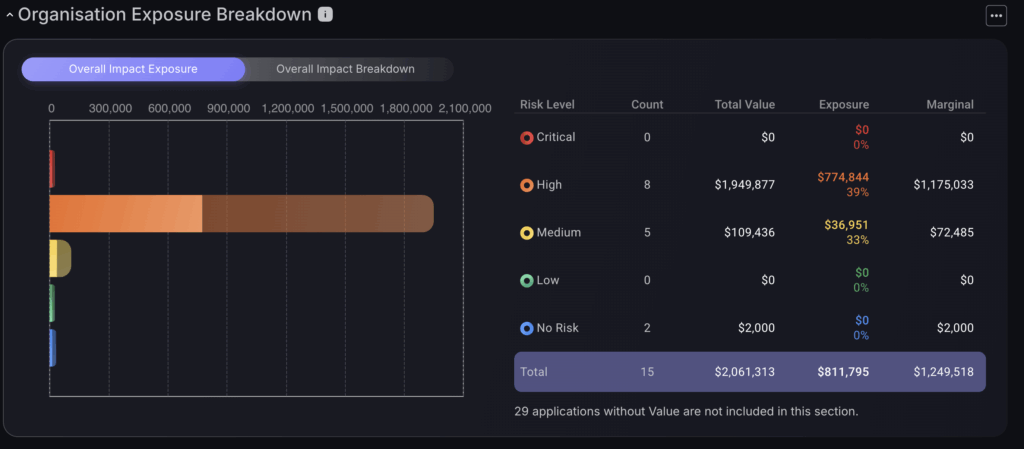
The Overall Impact Exposure provides a snapshot of the potential effect on the financial aspect of the vulnerabilities detected for the organisation, broken down into risk levels. A colour-coded bar chart represents the visual interpretation of the potential financial impact or Exposure as a result of the threats. Underneath, is a tabulated summary showing the breakdown of Exposure for each risk level.
To view the overall impact breakdown click on the gray button underneath the tab title. This displays a pie chart of all the applications affected allowing you to view the impact exposure of each app. To go back, press the blue circle in the middle of the pie chart. There is an option to filter the number of apps in the pie chart in the top left side of the screen which gives a drop down of options.
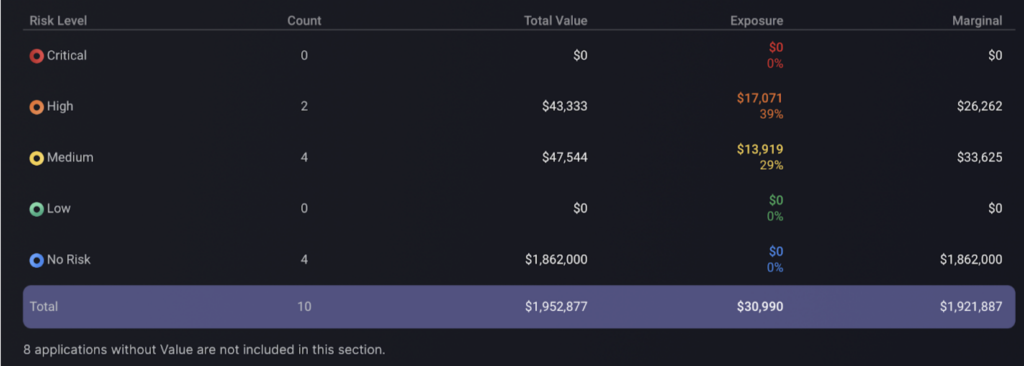
Impact breakdown
Impact breakdown table
This table breaks down the monetary exposure of each application grouping them by risk level. The total value column represents the monetary value associated with the assets or issues in each risk category. The exposure indicates the potential financial impact or exposure from the risks identified, expressed both in dollars and as a percentage. The marginal columnshows the marginal impact, indicating the monetary value of all applications after the exposure has been subtracted from the total value.
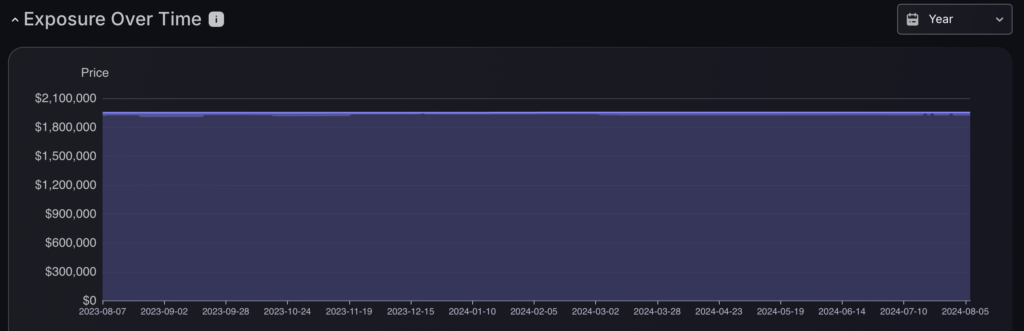
Exposure over time
By tracking financial exposure related to cybersecurity threats consistently over time, the graph provides clear visibility into the financial impacts of potential security incidents. This continuous monitoring enables users to identify trends, assess the effectiveness of implemented security measures, and anticipate future risks. There is an option to select different time frames in the top right hand corner.
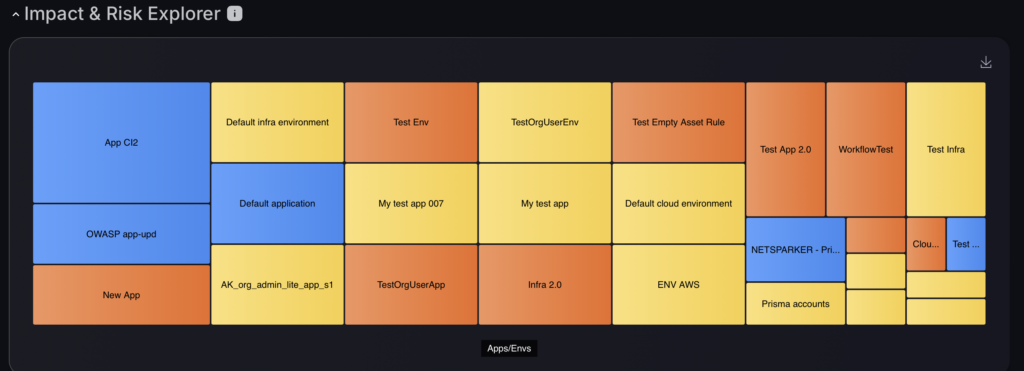
Impact and risk explorer
This tab offers a comprehensive view of applications and environments within an organisation, using colour-coded blocks to highlight different levels of risk and impact. This layout helps in quickly pinpointing critical assets and streamlining the prioritization of security efforts. The dashboard is also likely interactive, allowing for clicks on specific applications or environments to reveal more detailed information. This feature facilitates deeper analysis and more informed decision-making about potential vulnerabilities and security management with the option to open an asset dashboard for all assets within an environment/application.
Main pages from navigation bar
Each section within the interface is designed to target specific areas of your security infrastructure, enabling you to isolate and scrutinize potential risks in detail. By navigating through these dedicated sections, you can delve into areas that require immediate attention, conduct thorough risk assessments, and start prioritizing vulnerabilities. organization.
Phoenix Security has ten main pages that can be easily accessed through the navigation menu:
1.Risk explorer
a. Environments
The “Environments” page on the Phoenix Security platform provides tools for detailed management and oversight of various environments within an organization. It features selection options that allow users to choose specific environments to view. Users can also apply filters by category, tags, users, or teams to narrow down the environments displayed according to relevant criteria. Additionally, there are toggles to select and view different types of assets, such as cloud, infrastructure, and container assets.
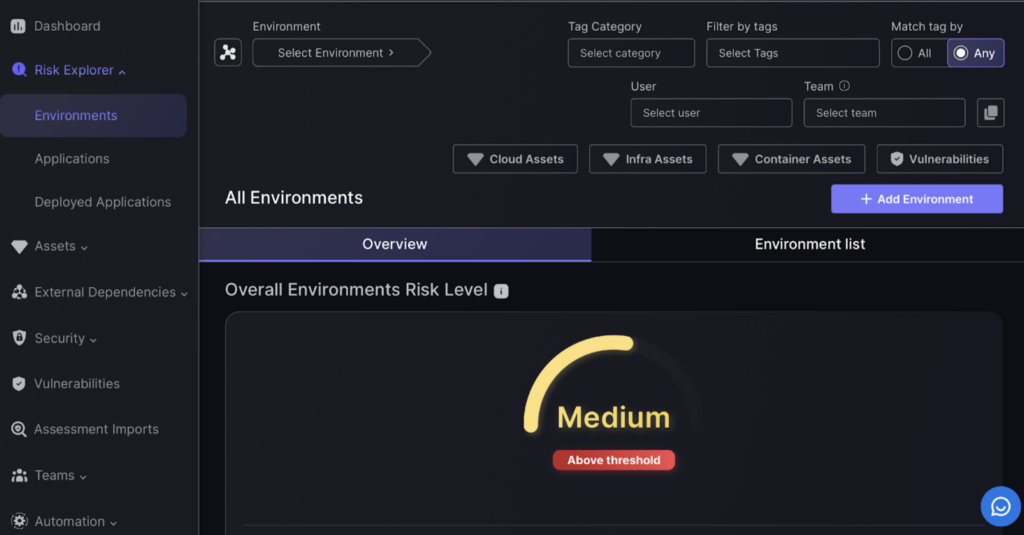
The Environments page provides a quick look at your Environments’ overall health and risk assessment. This page also lets you perform other actions such as create or import a new Environment, export existing Environments, and download the Environment template.
b.Applications
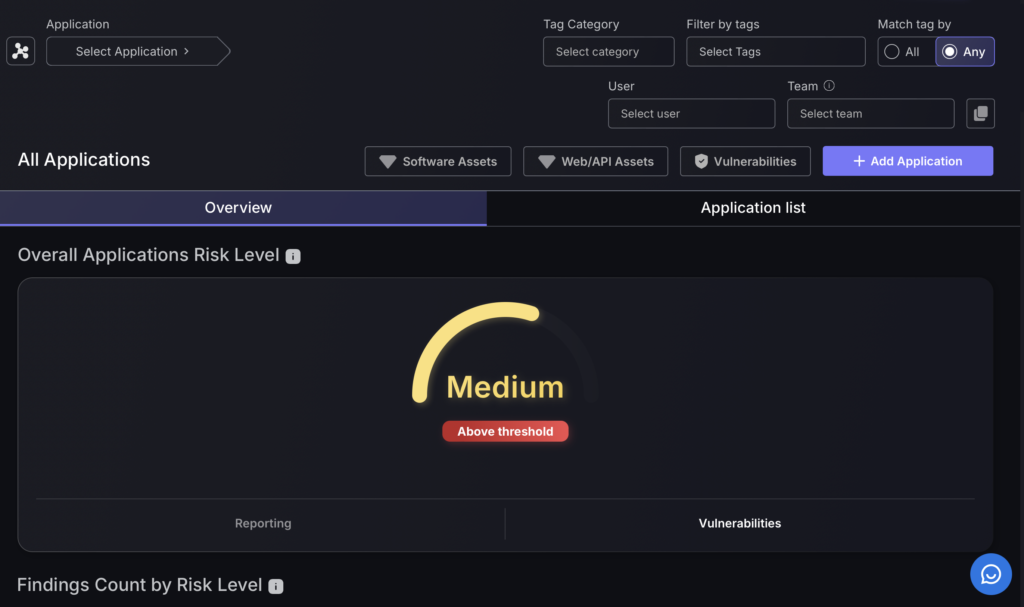
The “Applications” section in the Phoenix Security platform is designed to manage software applications across an organization. It features a selection tool that allows for easy access to specific applications, complemented by filtering options that help refine the search based on various attributes such as category, tags, user, and team affiliations. Additionally, the interface includes toggles that categorize applications by asset type, providing a structured view of applications within the organizational framework.
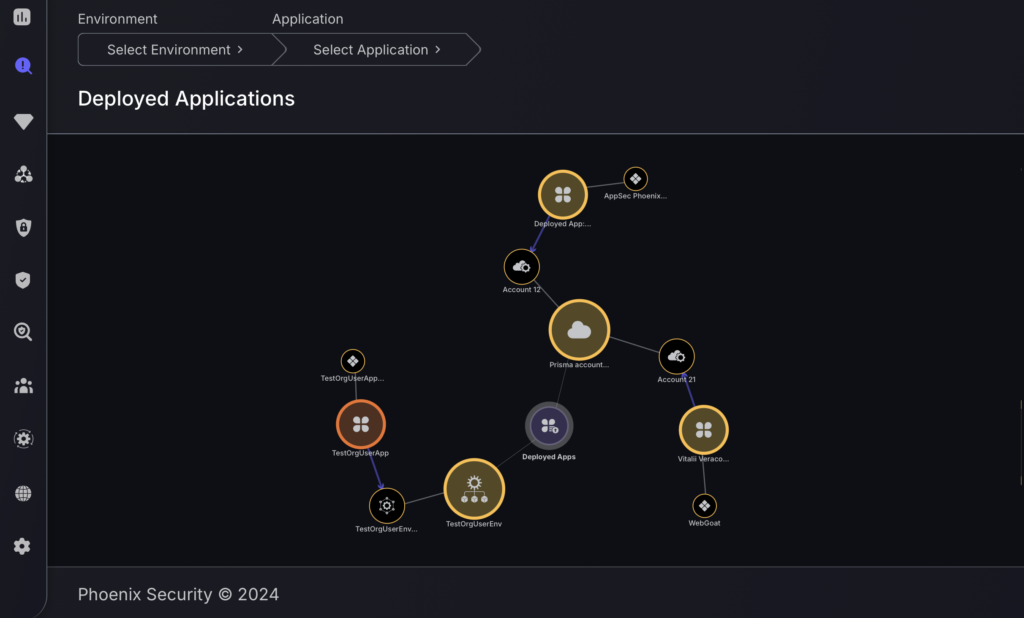
c.Deployed applications
The “Deployed Applications” section is designed for overseeing applications that have been deployed within various environments. This section provides tools for selecting specific environments and applications for a focused review. The interface presents a visual map showing the relationship between different deployed applications and their respective environments, marked with icons that represent different types of assets. Each application node on the map is interactive and displays a breakdown of vulnerabilities by severity levels, ranging from critical to none, upon selection. This organizational approach helps in visually tracking the distribution and status of deployed applications across the network.
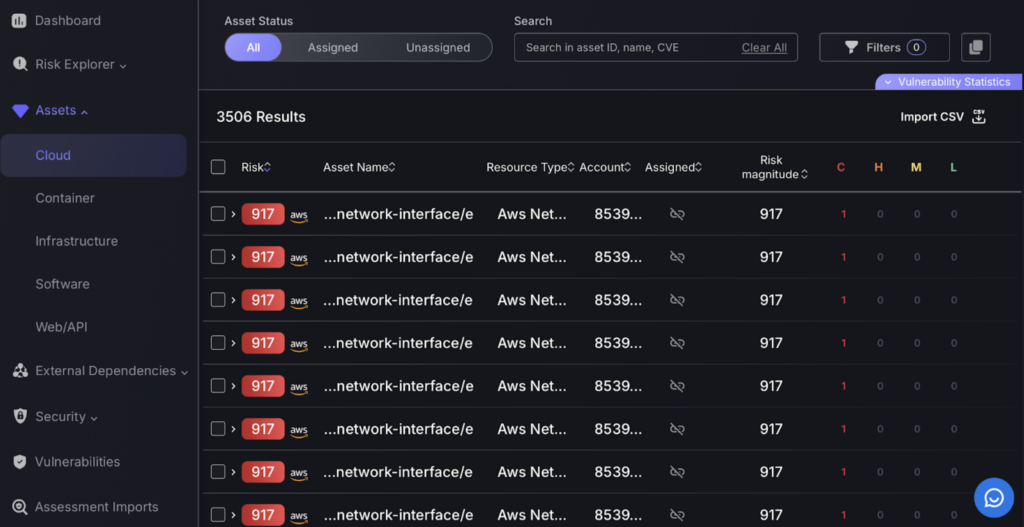
2. Assets
In the “Assets” section of the Phoenix Security platform, you can manage vulnerabilities across various asset categories:
- Cloud
- Container
- Infrastructure
- Software
- Web/API
Each category page provides a filter bar and a search bar to help you refine and locate specific vulnerabilities within that asset type. Additionally, there is an option to import vulnerabilities via a CSV file, allowing for streamlined integration and update of vulnerability data across different assets.
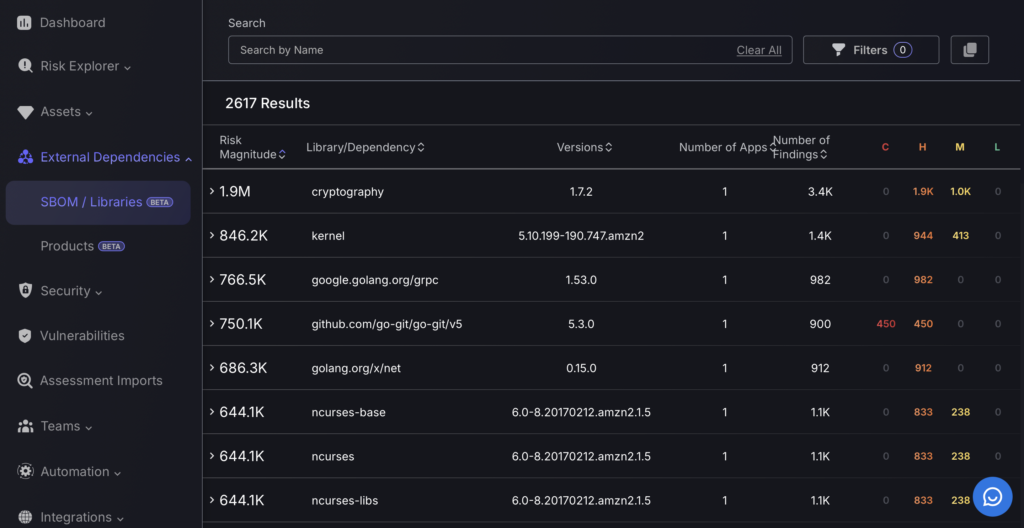
3. External dependencies
The “External Dependencies” section of the Phoenix Security platform is divided into two main subsections: SBOM/Libraries and Products.
- SBOM/Libraries: This subsection focuses on software bills of materials and libraries, detailing dependencies that are integrated into various software applications. It lists items such as library names, their versions, and provides a quantifiable risk assessment along with the number of associated findings.
- Products: This area catalogs different software products, listing details like product names, versions, and the environments or assets they are associated with. It also quantifies risk and summarizes the total number of environments and assets linked to each product.
These sections allow for a thorough inspection and management of all software components and products of external dependency.
The Users Management page lists down the users who have access to your organisation’s Phoenix Security instance. Here you can also add and delete users, set permissions or roles, and search for existing users.
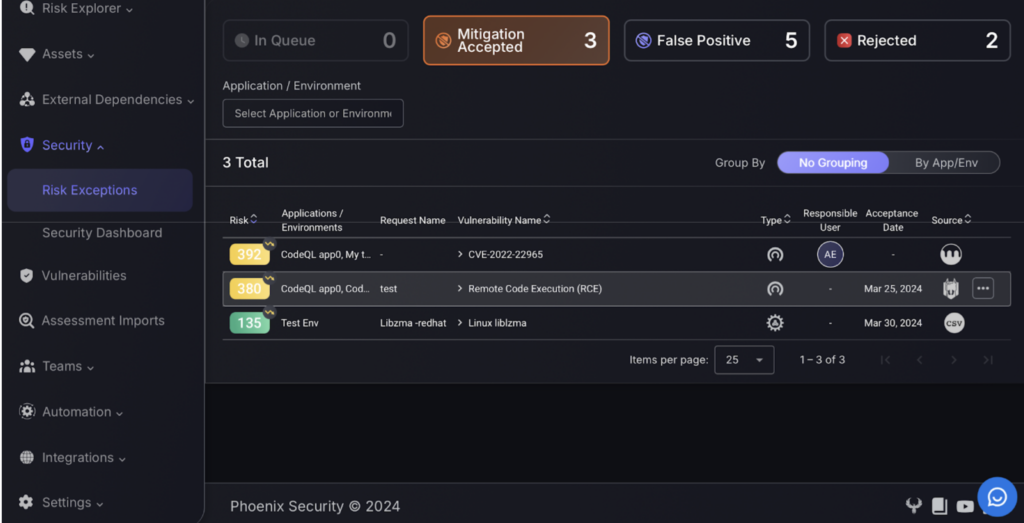
4. Security
The “Security” section in the Phoenix Security platform encompasses two main areas:
- Risk Exceptions: This area focuses on managing exceptions to security risks identified across the organization’s applications and environments. It categorizes exceptions into various statuses such as “In Queue,” “Mitigation Accepted,” “False Positive,” and “Rejected,” allowing for structured tracking and resolution of exceptions.
- Security Dashboard: This dashboard aggregates and displays key security metrics and statuses within the organization. It provides a consolidated view of risks, highlighting the overall risk level and detailing specific findings categorized by risk severity, assisting in the broader oversight of the organization’s security posture.
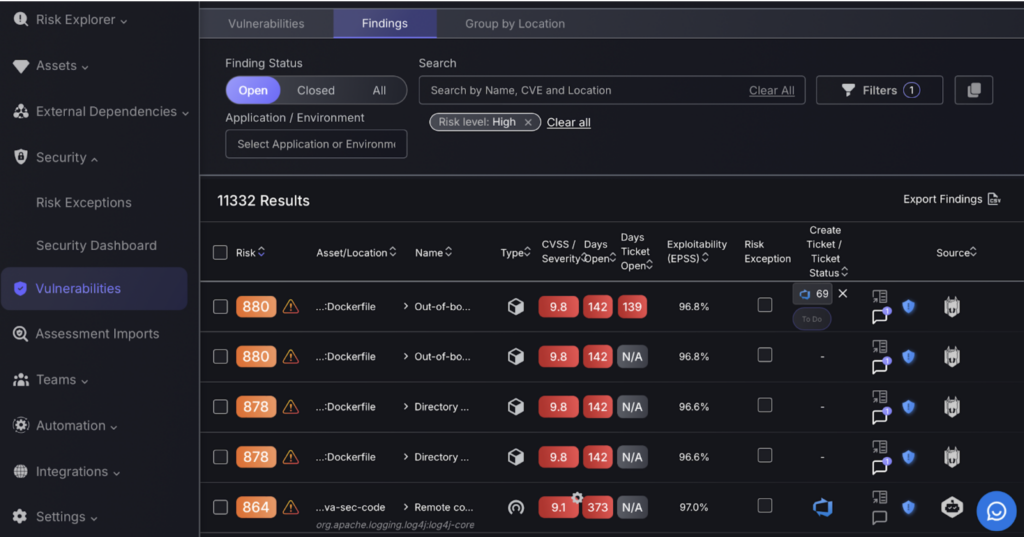
5. Vulnerabilities
The “Vulnerabilities” section of the Phoenix Security platform offers a detailed interface for managing security vulnerabilities. This section includes advanced filter options that allow you to narrow down and view vulnerabilities based on specific criteria like risk levels or associated environments. By clicking on a particular vulnerability, you can access detailed findings that provide in-depth insights into each identified issue. This setup facilitates precise tracking and management of vulnerabilities.
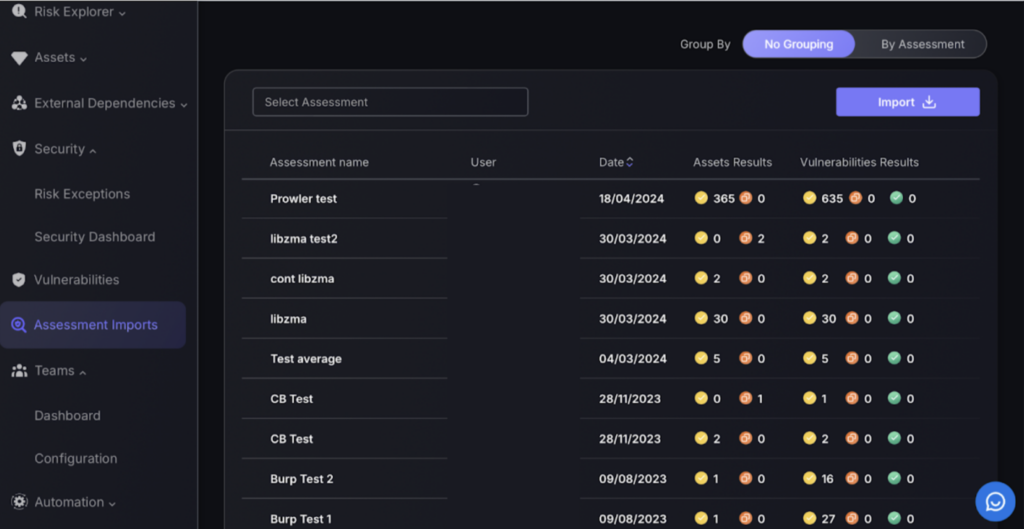
6. Assessment imports
The “Assessment Imports” section in the Phoenix Security platform enables the integration of external vulnerability reports into the system. This area allows for manual importing of detailed reports, which typically consist of a list of vulnerabilities along with the affected assets. It features functionalities to select and import various assessments, displaying the user who performed the import, the date of the import, and a summary of results related to the number of assets and vulnerabilities identified in each report. This capability is vital for incorporating external security analysis into the comprehensive risk management framework of the platform.
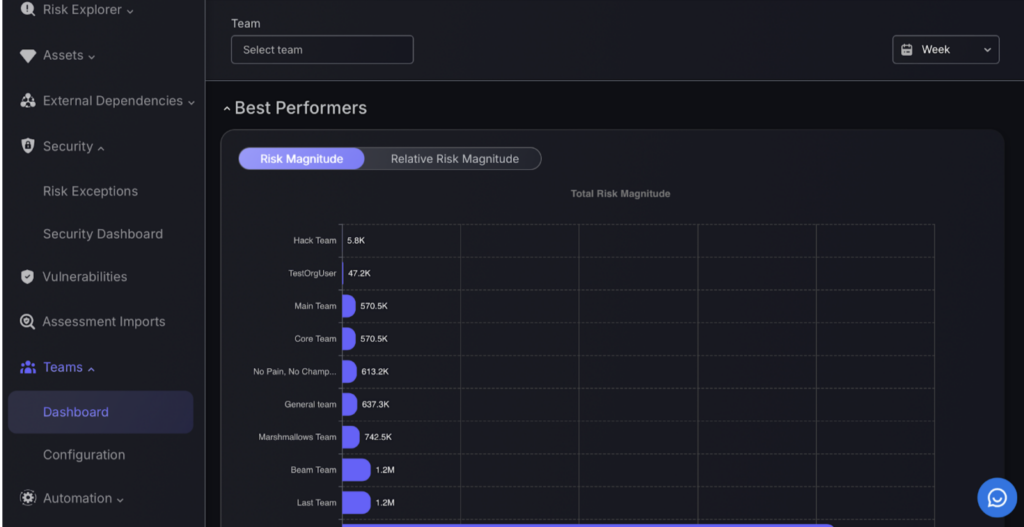
7. Teams
The “Teams” section of the Phoenix Security platform consists of two main parts:
- Dashboard: Here, you can view various metrics related to the performance of different teams. It includes details like changes in risk magnitude and updates on vulnerabilities, offering a straightforward assessment of each team’s security efforts.
- Configuration: This section allows for the setup and management of teams. It provides functionalities to create new teams or adjust existing ones, showing relevant details like the number of managed assets and team members.
These sections are designed to help monitor and manage team activities progress in terms of security.
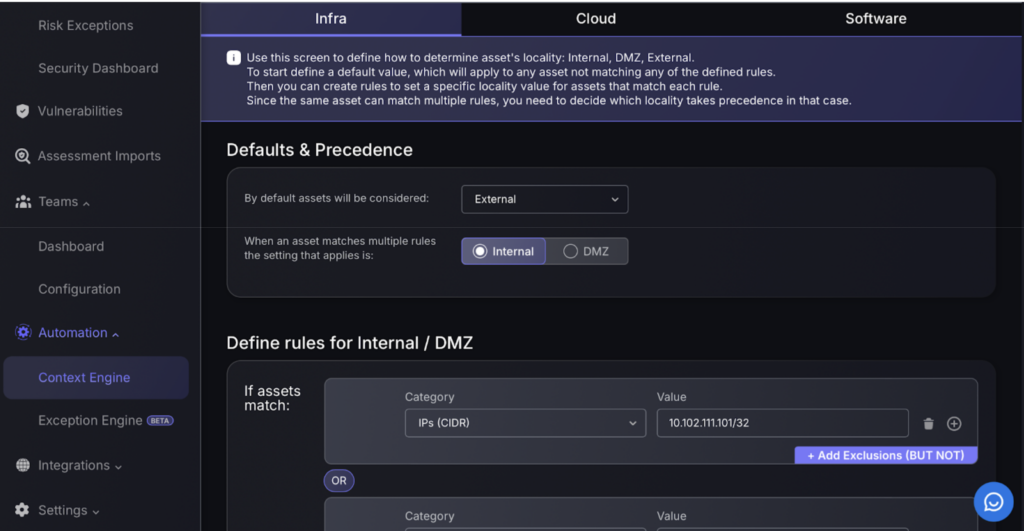
8.Automation
The Automation section allows you to manually create rules/exceptions to tailor risk management through the Context Engine and Exception Engine options. The Context Engine is designed to define how assets are automatically categorized within the network as Internal, DMZ, or External based on set rules. It allows the establishment of default settings that apply when no specific rules match, ensuring that all assets are classified systematically. Additionally, the interface provides options to set exclusions, further refining the categorization process.
The Exception Engine allows for detailed customization of security protocols by enabling the creation of exception rules. These rules can be scheduled or manually triggered, depending on the need. For each rule, conditions are set based on various categories, which, when met, initiate specified actions such as classifying findings as either ‘Risk Mitigation’ or ‘False Positive’. This setup provides a mechanism to handle unique or unexpected scenarios by adjusting the security measures to be either more lenient or stringent, thereby aligning security responses more closely with real-world conditions.
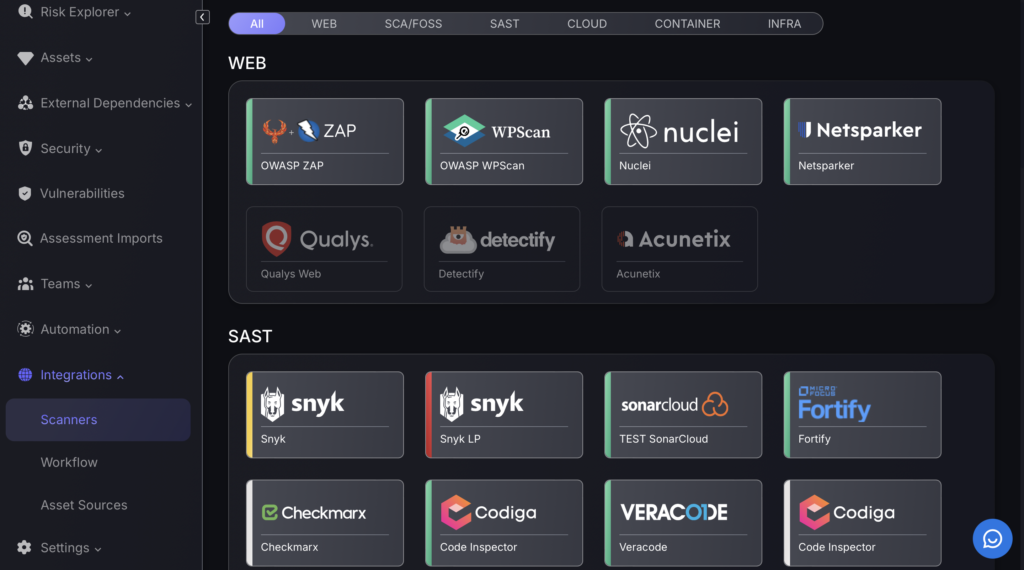
9.Integrations
The Integrations section is dedicated to managing and configuring connections with various external tools, enhancing the system’s overall functionality. It includes:
- Scanner Integrations: This part of the platform allows for the management of connections with different security scanners, enabling comprehensive vulnerability assessments across web, cloud, and infrastructure assets.
- Workflow Integrations: Supports integration with workflow management systems to streamline operations. This facilitates ticketing and notifications, ensuring efficient tracking and management of security issues.
- Asset Source Integrations: Focuses on connecting external asset sources to maintain an updated asset inventory. This ensures that all security data is synchronized and current across different platforms.
10. Organization settings
The Settings section in Phoenix Security is structured into three main categories, each designed to manage different aspects of the platform’s operational and administrative settings:
- Users: This area allows for the management of user accounts within the system. Administrators can add new users, assign roles, and allocate them to specific teams, ensuring that each user has the appropriate level of access and responsibility within the platform.
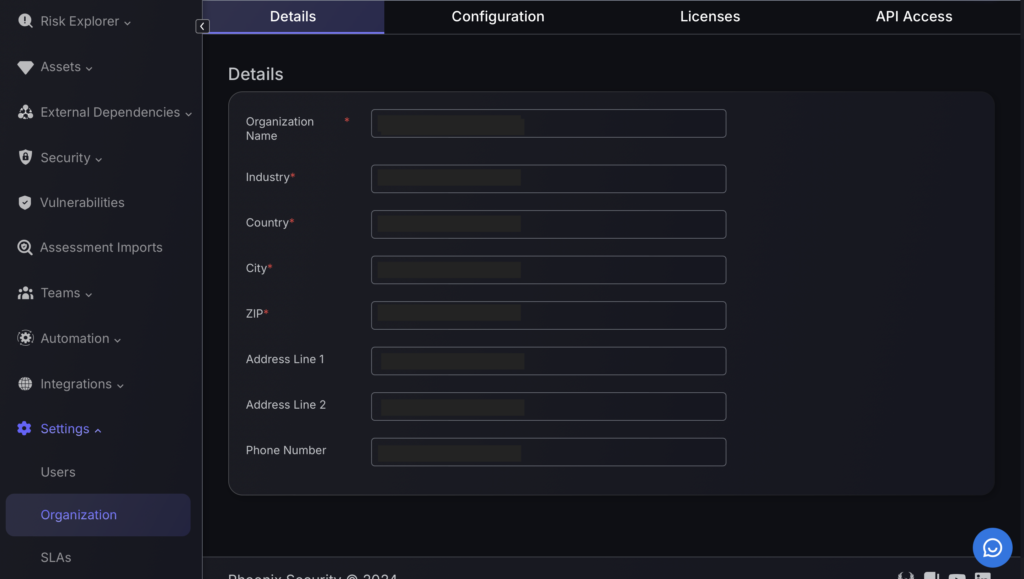
- Organization: This category is further divided into four subcategories:
- Details: Administrators can update the organization’s basic information such as name, industry, and contact details.
- Configuration: This tab provides options to set operational thresholds and preferences, such as financial thresholds and automated processes like ticket pushing.
- Licenses: Shows the current status of various licenses and their usage, helping manage the allocation and utilization of system resources.
- API Access: Manages API credentials, which are crucial for integrating the platform with other systems or services securely.
- SLAs (Service Level Agreements): This section is dedicated to establishing and monitoring service level agreements related to the management of vulnerabilities. It helps set expectations for response times and resolution strategies, ensuring that these align with the organization’s operational standards.